


IndyMike
Members
-
Joined
-
Last visited
-
I don't have an Eisy, but you should see some activity in the Event Viewer (Level 3) when it tries to read the PLM. The 1st line [GET-LNK-RSP] is a must. If it is not displayed, the Eisy isn't trying to read the PLM. If the process is functioning correctly, the Eisy will continue issuing [GET-NEXT-LNK-RSP] commands until it hits the end of the PLM table. Sat 09/26/2026 05:05:07 PM : [GET-LNK-RSP ] 02 69 06 Sat 09/26/2026 05:05:07 PM : [LNK-DATA ] 02 57 E2 00 58 B0 78 01 20 45 Sat 09/26/2026 05:05:08 PM : [GET-NEXT-LNK-RSP] 02 6A 06 Sat 09/26/2026 05:05:08 PM : [LNK-DATA ] 02 57 E2 10 58 B0 78 01 20 45
-
@oberkc , I know you said this program worked previously, but... Shouldn't the sunset trigger be an "or" instead of "and"? Edit: Never mind, I get it now.
-
@DNewkirk , I'll start by saying that I'm using an ISY994 - things normally translate well, but there's always a caveat... I interpret the "Backlight" dropdown as "command only". It has no knowledge of the current state of your devices. As you indicated, it does have "stiction" allowing you to set multiple devices to the same level. For I2 KPL's. a query will return the backlight level of a device in D9 of a a "Extended Set/Get command - 2E" extended message . This will show the current setting of the actual device. The full sequence shown in the event viewer follows. The highlighted "09" being returned corresponds of an off level of 0 and on level of 9. Sat 09/19/2026 09:05:59 AM : [INST-TX-I1 ] 02 62 1C DF 01 0F 19 00 Sat 09/19/2026 09:05:59 AM : [INST-ACK ] 02 62 1C.DF.01 0F 19 00 06 LTSREQ (LIGHT) Sat 09/19/2026 09:05:59 AM : [INST-SRX ] 02 50 1C.DF.01 53.BC.3A 2B F6 00 (00) Sat 09/19/2026 09:05:59 AM : [Std-Direct Ack] 1C.DF.01-->ISY/PLM Group=0, Max Hops=3, Hops Left=2 Sat 09/19/2026 09:06:00 AM : [D2D EVENT ] Event [1C DF 1 1] [ST] [0] uom=100 prec=0 Sat 09/19/2026 09:06:00 AM : [ 1C DF 1 1] ST 0 (uom=100 prec=0) Sat 09/19/2026 09:06:00 AM : [D2D EVENT ] Event [1C DF 1 1] [OL] [255] uom=100 prec=0 Sat 09/19/2026 09:06:00 AM : [ 1C DF 1 1] OL 255 (uom=100 prec=0) Sat 09/19/2026 09:06:00 AM : [D2D EVENT ] Event [1C DF 1 1] [RR] [28] uom=25 prec=0 Sat 09/19/2026 09:06:00 AM : [ 1C DF 1 1] RR 28 (uom=25 prec=0) Sat 09/19/2026 09:06:00 AM : [INST-TX-I2CS] 02 62 1C DF 01 1F 2E 00 01 00 00 00 00 00 00 00 00 00 00 00 00 D1 Sat 09/19/2026 09:06:00 AM : [INST-ACK ] 02 62 1C.DF.01 1F 2E 00 01 00 00 00 00 00 00 00 00 00 00 00 00 D1 06 (00) Sat 09/19/2026 09:06:00 AM : [INST-SRX ] 02 50 1C.DF.01 53.BC.3A 2B 2E 00 (00) Sat 09/19/2026 09:06:00 AM : [Std-Direct Ack] 1C.DF.01-->ISY/PLM Group=0, Max Hops=3, Hops Left=2 Sat 09/19/2026 09:06:01 AM : [INST-ERX ] 02 51 1C DF 01 53 BC 3A 16 2E 00 01 01 02 00 20 20 1C FF 09 C0 00 00 00 00 Sat 09/19/2026 09:06:01 AM : [Ext-Direct ] 1C.DF.01-->ISY/PLM Group=0, Max Hops=2, Hops Left=1 Changing the backlight to a max level of 7/15 results in the following (abbreviated): Sat 09/19/2026 09:07:51 AM : [INST-TX-I2CS] 02 62 1C DF 01 1F 2E 00 01 00 00 00 00 00 00 00 00 00 00 00 00 D1 Sat 09/19/2026 09:07:51 AM : [INST-ACK ] 02 62 1C.DF.01 1F 2E 00 01 00 00 00 00 00 00 00 00 00 00 00 00 D1 06 (00) Sat 09/19/2026 09:07:52 AM : [INST-SRX ] 02 50 1C.DF.01 53.BC.3A 2B 2E 00 (00) Sat 09/19/2026 09:07:52 AM : [Std-Direct Ack] 1C.DF.01-->ISY/PLM Group=0, Max Hops=3, Hops Left=2 Sat 09/19/2026 09:07:52 AM : [INST-ERX ] 02 51 1C DF 01 53 BC 3A 11 2E 00 01 01 02 00 20 20 1C FF 7F C0 00 00 00 00 The "LED brightness" button will show what the ISY "believes" the device back light "should be". It is based on a device Image retained in the ISY. It does NOT appear to respond to the device query. In other words, your actual device setting may be different. If they are different, a device restore should restore the ISY settings.
-
If you can Telnet into the ISY, here's another process: https://wiki.universal-devices.com/ISY-99i/ISY-26_INSTEON:Replacing/Formatting_an_SD_Card I just tried this, it does work on the ISY994.
-
New card not formatted properly or incompatible? Is it truly a new unformatted card? If it's the correct card size you could copy the files from the old card using a PC. Note that people have had issues initializing/copying files using a Mac.
-
Curious that Mobilinc works but you can't connect locally. When you do a manual "Add" in the IOX finder, what does it show you when you try to connect? You could also try to connect to the ISY shell via Telnet - https://docs.universal-devices.com/production/ISY%20Advanced%20Configuration%20Guide.pdf
-
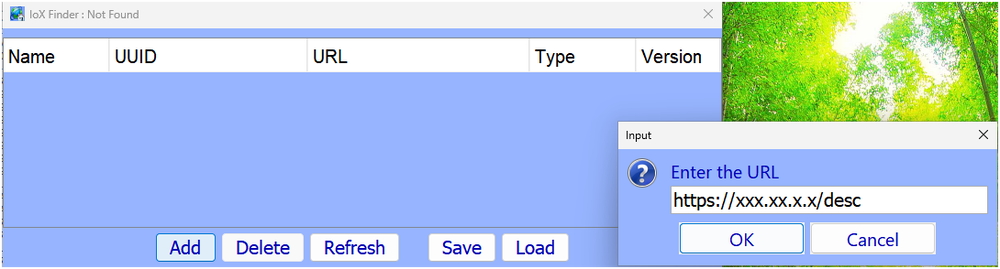
If you can ping the ISY you should be able to manually add the address: Click the "Add" button and manually add the local address as shown. Also add an address for http ( http://xxx.xx.x.x/desc). After doing this click "save" and save the configuration to a local file for the Next time things are lost. Use the "Load" command from the file you created. My "saved" file is from 2022, still working.
-
@mmb , I second the opinion that performing a whole house query may be doing more harm than good. This is particularly true if your overall communication (and scene accuracy) is good - meaning that you don't benefit from the query. Why you ask? It turns out there are serial communication errors occurring regularly between the ISY and the PLM. Most of the time these are harmless and the ISY simply retries the command and we never know the problem occurred. Rarely, the corruption results in a valid command that the PLM puts on the powerline (think all-on/all-off). @kclenden was the 1st to document that these errors were occurring and could cause All-on/all-off events. Since that time I have see 1 case of a All-on and 1 instance of the PLM Reset due to corrupted communications. The communication errors are more frequent during periods of heavy communication - Device restores, Program activity with no delays, and system queries. I have found a mitigation on the ISY994 using the low level "CD" (configure delay) command through the ISY Shell interface (Telnet). This allows you to reduce the rate of successive commands that the ISY issues to the PLM. Unfortunately, I don't believe this exists on the EISY. This is why I would recommend eliminating the query-all if you can tolerate it. Another possibility would be to shorten/improve the quality of the serial/usb cable to the EISY. I have not found this to help on the ISY994, but the EISY is a different animal.
-
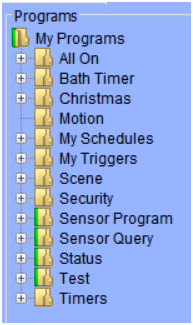
@MMAltair , I am starting to believe that your EISY filesystem was corrupted during the power outage. You will not be able to do much with only 10 devices in your PLM. You can try another PLM restore to see if that corrects the issue, but my guess is that the EISY image has been corrupted. BEFORE you perform the restore, open the Event Viewer on Level 3. The EISY will then show you exactly which device records are being written to the PLM as in the example below. If you wind up with a "short list" of devices, the EISY image is corrupt. To restore properly, you will need to find a good backup. Programs can be exported to save them. I have had mixed results with this. The best results were obtained by exporting each subfolder to a separate file (do not try to save "My Programs" itself). You can also export individual programs. I would suggest trying this (export/import) to make sure you understand the functionality prior to restoring the backup. You can import folders/programs as a test and then hit "undo changes". If you believe you have a good restore (all 41 of your devices) then you can start working through any remaining communication issues. PLM Restore Snippet Mon 07/27/2026 08:51:35 AM : [ 53 BC 3A 1] Restoring PLM Mon 07/27/2026 08:51:35 AM : [ 58 B0 78 1] Replacing PLM links (locally and in PLM) Mon 07/27/2026 08:51:35 AM : [ 58 B0 78 1] Replacing PLM links Successful Mon 07/27/2026 08:51:35 AM : [ 1A 5D C7 1] Replacing PLM links (locally and in PLM) Mon 07/27/2026 08:51:35 AM : [ 1A 5D C7 1] Replacing PLM links Successful Mon 07/27/2026 08:51:35 AM : [ C C2 32 1] Replacing PLM links (locally and in PLM) Mon 07/27/2026 08:51:35 AM : [ C C2 32 1] Replacing PLM links Successful Mon 07/27/2026 08:51:35 AM : [ 18 93 83 1] Replacing PLM links (locally and in PLM) Mon 07/27/2026 08:51:35 AM : [ 18 93 83 1] Replacing PLM links Successful Mon 07/27/2026 08:51:35 AM : [ 58 B0 74 1] Replacing PLM links (locally and in PLM) Mon 07/27/2026 08:51:35 AM : [ 58 B0 74 1] Replacing PLM links Successful Mon 07/27/2026 08:51:35 AM : [ 16 CD 80 1] Replacing PLM links (locally and in PLM) Mon 07/27/2026 08:51:35 AM : [ 16 CD 80 1] Replacing PLM links Successful Mon 07/27/2026 08:51:35 AM : [ 41 21 1 1] Replacing PLM links (locally and in PLM) Mon 07/27/2026 08:51:35 AM : [ 41 21 1 1] Replacing PLM links Successful Mon 07/27/2026 08:51:35 AM : [ 29 53 3C 1] Replacing PLM links (locally and in PLM) Mon 07/27/2026 08:51:35 AM : [ 29 53 3C 1] Replacing PLM links Successful
-
There's a bit to unpack here... Normally when you delete a device it removes all links/scenes from the ISY. Relinking (if you chose remove existing links) refreshes the device with a responder link to the PLM and a controller link to the PLM. Your device has "old links" from scenes that no longer exist. I've never seen that before (Curious), but it's not necessarily a problem. You might try a factory reset to see if things behave differently. Also curious that you still have a (!) on this device. The ISY was able to program it and read the link table. Obviously it CAN communicate with the device. Not sure why it would flag it as non-responding. Could you perform a link table read on the device with the event viewer on level 3, then post the viewer contents? This would help to assess communications with the device. You should NOT need to remove the device from scenes prior to a delete. The ISY will do this automatically. You likely have some "pending writes" on your devices. When the ISY is asked to update a specific device it will also try to update any other devices that are flagged as needing updates. The ISY994 has a method to turn off automatic write to devices. Not sure if that is available on the EISY. That PLM table is a definite problem. It shows links to 10 of your 41 devices. It is either a partial listing (interrupted by communications) or a corrupt table. If you could try a few more reads to verify the contents, that would help. Otherwise you need to restore (or restore from a difference backup).
-
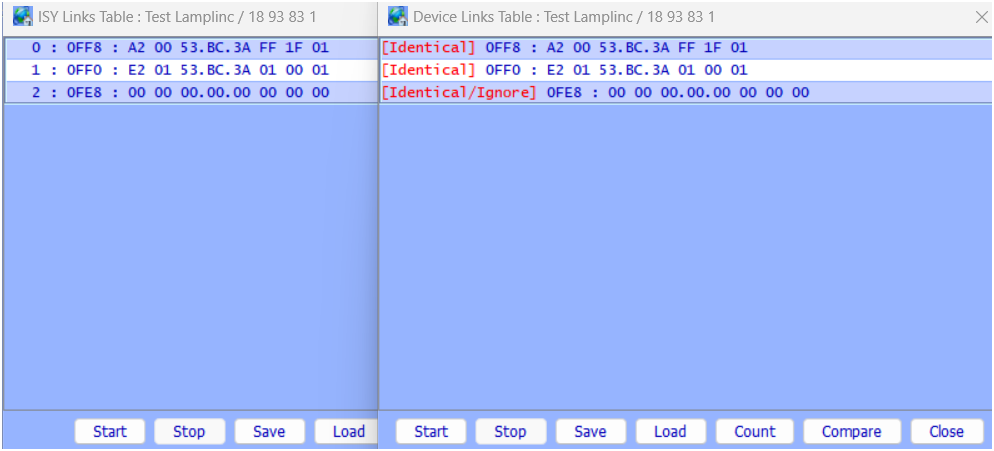
@MMAltair , you can disregard the mismatch @0FF0. the the "A" in the "EA" byte is a feature associated with newer device communications. For all intents and purposes, the tables are identical. This devices has controller and responder links to your PLM and nothing else. It is not currently included in any scenes. I'm a little confused by the fact that the device table shows deleted entries on lines 2, 3, and 4. Normally deleting the device/re-adding would eliminate these entries (like what I posted above). How are you deleting/re-adding? Does this device still have the (!) indicator?
-
@MMAltair, I am struggling to understand how your devices came to be programmed with the incorrect PLM address. The would normally require a PLM change and a corrupted restore, or a restore from a backup from a previous PLM (without the ISY knowing a New PLM was attached). Your description of events is not matching up with the symptoms. As a result, I'm very hesitant to suggest going to a new PLM. I do not see and indication that the old PLM has an issue. You have good communications, and your PLM can see device activations (sign that the PLM records are intact. Could you try restoring an older Eisy backup? Edit - before doing any thing drastic, could you perform/provide the following: Open the event viewer to level 3. Right click on a working device on the tree and select "Diagnostics\Show Device Link table" A window will pop up showing the device Links and the links will begin populating (reading in process). Once complete, click "Compare" on the lower right. Upload both the link table windows and the event viewer contents. Repeat the above for a device that is not working properly (!). Also - please confirm that your current PLM address is 3D.94.80 Example link records and event viewer for one of my devices shown below Example Link Table Read/Compare Example Link Table Communication in Event Viewer Wed 08/05/2026 07:51:58 AM : [INST-TX-I2 ] 02 62 18 93 83 1F 2F 00 00 00 0F FF 01 00 00 00 00 00 00 00 00 C2 Wed 08/05/2026 07:51:58 AM : [INST-ACK ] 02 62 18.93.83 1F 2F 00 00 00 0F FF 01 00 00 00 00 00 00 00 00 C2 06 (00) Wed 08/05/2026 07:51:58 AM : [INST-SRX ] 02 50 18.93.83 53.BC.3A 2F 2F 00 (00) Wed 08/05/2026 07:51:58 AM : [Std-Direct Ack] 18.93.83-->ISY/PLM Group=0, Max Hops=3, Hops Left=3 Wed 08/05/2026 07:51:59 AM : [INST-ERX ] 02 51 18 93 83 53 BC 3A 15 2F 00 01 01 0F FF 01 A2 00 53 BC 3A FF 1F 01 C2 Wed 08/05/2026 07:51:59 AM : [Ext-Direct ] 18.93.83-->ISY/PLM Group=0, Max Hops=1, Hops Left=1 Wed 08/05/2026 07:51:59 AM : [INST-TX-I2 ] 02 62 18 93 83 1F 2F 00 00 00 0F F7 01 00 00 00 00 00 00 00 00 CA Wed 08/05/2026 07:51:59 AM : [INST-ACK ] 02 62 18.93.83 1F 2F 00 00 00 0F F7 01 00 00 00 00 00 00 00 00 CA 06 (00) Wed 08/05/2026 07:51:59 AM : [INST-SRX ] 02 50 18.93.83 53.BC.3A 2F 2F 00 (00) Wed 08/05/2026 07:51:59 AM : [Std-Direct Ack] 18.93.83-->ISY/PLM Group=0, Max Hops=3, Hops Left=3 Wed 08/05/2026 07:52:00 AM : [INST-ERX ] 02 51 18 93 83 53 BC 3A 15 2F 00 01 01 0F F7 01 E2 01 53 BC 3A 01 00 01 CA Wed 08/05/2026 07:52:00 AM : [Ext-Direct ] 18.93.83-->ISY/PLM Group=0, Max Hops=1, Hops Left=1 Wed 08/05/2026 07:52:00 AM : [INST-TX-I2 ] 02 62 18 93 83 1F 2F 00 00 00 0F EF 01 00 00 00 00 00 00 00 00 D2 Wed 08/05/2026 07:52:00 AM : [INST-ACK ] 02 62 18.93.83 1F 2F 00 00 00 0F EF 01 00 00 00 00 00 00 00 00 D2 06 (00) Wed 08/05/2026 07:52:00 AM : [INST-SRX ] 02 50 18.93.83 53.BC.3A 2F 2F 00 (00) Wed 08/05/2026 07:52:00 AM : [Std-Direct Ack] 18.93.83-->ISY/PLM Group=0, Max Hops=3, Hops Left=3 Wed 08/05/2026 07:52:01 AM : [INST-ERX ] 02 51 18 93 83 53 BC 3A 15 2F 00 01 01 0F EF 01 00 00 00 00 00 00 00 00 D2 Wed 08/05/2026 07:52:01 AM : [Ext-Direct ] 18.93.83-->ISY/PLM Group=0, Max Hops=1, Hops Left=1
-
@MMAltair thanks for the log. In general, your communications to the devices are good. The NACK's are not. These are programming errors at the device. You have 1 device that is returning a NACK (4D.9B.F0). This is an indication that a I2CS device is not programmed with your current PLM address. This should have nothing to due with a power outage. Try a "restore device" on this device. If it does not correct the problem, then the ISY image is corrupt for this unit. If this is the only device affected, a "delete/re-add" should correct the problem. If you have many devices affected we need to dig a bit deeper. I can't comment on devices that were not responding (!) because there weren't any in the log. You mentioned 15 devices that were having issues. If see the 1 NACK in the log, can't help with the others.
-
OK the mobile app would make sense for the rest commands. I would not suspect the new PLM programming. That would result in consistent failures for a given device. That is not my understanding of your problem. This really sound like a classic noise/signal absorption problem. You need to use a methodical process to isolate when/where the problem is. If the problem is always/frequently present, you can turn off breakers in an attempt to improve communications. Also inspect the circuit the PLM is on for any new or possibly failing devices. If the problem occurs at certain times of the day, try to alter the timing of events to improve communications (well pumps, heat pumps, photo cells, etc). These are the worst to locate. Noise/absorption related to certain devices turning on can be a horrible pain to isolate. They require a lot of patience and observation to pin down. You can use the event viewer to monitor "hops remaining" in response to a system query to assess communication quality. If you find a problem device, you can use the "show link table" feature to interrogate the device table. This is a rather intensive read procedure that will show problems if communication issues are present. As you acquire data, post it to the forum. As an example - I had a variable speed heat pump/condenser installed a few year ago. For the 1st couple of years I had no issues. Then it got hot and the heat pump started hitting 80%+ speed levels. As soon as it did, my I1 (powerline only) devices near the electrical panel went offline. Took me quite awhile to pin down. It's been pretty hot this year...
-
@sndflea , The Event Viewer output does not appear to match the programs that you posted - was that intentional? The log shows that you attempted to turn off 10 devices using direct commands (device specific - no scenes). Direct commands require that the device respond with it's acknowledgment of the command. 3 of the devices did not respond (Err 1). 2 of the devices appear to be older based on their addresses (2C 36 41, 18 A0 D7) and may be powerline only devices. The third is more recent (47.E2.57) and would likely be dual band (unless it's a IOlinc). Other than the errors, your communications aren't stelar, but they are not horrible either. From the statistics below, 72% of the commands used 1 Hop (good) with the remaining commands using 2 Hops (Fair). It does appear that you are dealing with signal absorption or noise. The troubleshooting links that @Geddy supplied are applicable. I find it interesting that all of the commands being issued are "rest commands" as if they originated external to the EISY. I am not that familiar with the EISY (I use the ISY994). Were these OFF commands generated by another controller or by a EISY program? Sat 08/01/2026 09:14:07 AM : Create REST U7 [/rest/nodes/2C%2036%2041%201/cmd/DON/0/51] Sat 08/01/2026 09:14:07 AM : U7 Rest: submitCmd([2C 36 41 1],[DON],[<NULL>]) Sat 08/01/2026 09:14:07 AM : [INST-TX-I1 ] 02 62 2C 36 41 0F 13 00 Sat 08/01/2026 09:14:07 AM : [INST-ACK ] 02 62 2C.36.41 0F 13 00 06 LTOFFRR(00) Sat 08/01/2026 09:14:11 AM : [D2D EVENT ] Event [2C 36 41 1] [ERR] [1] uom=0 prec=-1 Sat 08/01/2026 09:14:11 AM : [2C 36 41 1 ] ERR 1 Event Viewer Statistics Elapsed Time 0:01:41 Communications TX-I1 10 TX-I2 0 INST-ACK 10 INST-SRX 7 INST-ERX 0 Total Comms 27 Errors Unknown 0 ERR 1 3 Unexpected Response 0 Unexpected, Ignored 0 Failed 0 Hops Max Hops=3, Hops Left=3 0 Max Hops=3, Hops Left=2 5 Max Hops=3, Hops Left=1 2 Max Hops=3, Hops Left=0 0 Max Hops=2, Hops Left=2 0 Max Hops=2, Hops Left=1 0 Max Hops=2, Hops Left=0 0 Max Hops=1, Hops Left=1 0 Max Hops=1, Hops Left=0 0 Hop Efficiency 0 Hops Used 0 0.00% 1 Hop Used 5 71.43% 2 Hops Used 2 28.57% 3 Hops Used 0 0.00%


